Unity Optimize Your Game Using Profiler
Performance is a key aspect of any game and no surprise, no matter how good the game is, if it runs poorly on the user's machine, it will not feel as enjoyable.
Since not everyone has a high-end PC or device (if you are targeting mobile), it's important to keep performance in mind during the whole course of development.
There are multiple reasons why the game could run slowly:
- Rendering (Too many high-poly meshes, complex shaders, or image effects)
- Audio (Mostly caused by incorrect audio import settings)
- Unoptimized Code (Scripts that contain performance-demanding functions in the wrong places)
In this tutorial, I will be showing how to optimize your code with the help of Unity Profiler.
Profiler
Historically, debugging performance in Unity was a tedious task, but since then, a new feature has been added, called Profiler.
Profiler is a tool in Unity that lets you quickly pinpoint the bottlenecks in your game by monitoring the memory consumption, which greatly simplifies the optimization process.
Bad Performance
Bad performance can happen at any time: Let's say you're working on the enemy instance and when you place it in the scene, it works fine without any issues, but as you spawn more enemies you may notice fps (frames-per-second) begin to drop.
Check the example below:
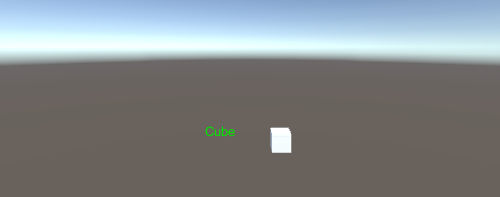
In the Scene, I have a Cube with a script attached to it, which moves the Cube from side to side and displays the object name:
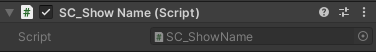
SC_ShowName.cs
using System.Collections;
using System.Collections.Generic;
using UnityEngine;

public class SC_ShowName : MonoBehaviour
{
    bool moveLeft = true;
    float movedDistance = 0;

    // Start is called before the first frame update
    void Start()
    {
        moveLeft = Random.Range(0, 10) > 5;
    }

    // Update is called once per frame
    void Update()
    {
        //Move left and right in ping-pong fashion
        if (moveLeft)
        {
            if(movedDistance > -2)
            {
                movedDistance -= Time.deltaTime;
                Vector3 currentPosition = transform.position;
                currentPosition.x -= Time.deltaTime;
                transform.position = currentPosition;
            }
            else
            {
                moveLeft = false;
            }
        }
        else
        {
            if (movedDistance < 2)
            {
                movedDistance += Time.deltaTime;
                Vector3 currentPosition = transform.position;
                currentPosition.x += Time.deltaTime;
                transform.position = currentPosition;
            }
            else
            {
                moveLeft = true;
            }
        }
    }

    void OnGUI()
    {
        //Show object name on screen
        Camera mainCamera = Camera.main;
        Vector2 screenPos = mainCamera.WorldToScreenPoint(transform.position + new Vector3(0, 1, 0));
        GUI.color = Color.green;
        GUI.Label(new Rect(screenPos.x - 150/2, Screen.height - screenPos.y, 150, 25), gameObject.name);
    }
}
Looking at the stats, we can see that the game runs at a good 800+ fps, so it barely has any impact on the performance.

But let's see what will happen when we duplicate the Cube 100 times:

Fps dropped by more than 700 points!
NOTE: All tests were done with Vsync disabled
Generally, it's a good idea to start optimizing when the game begins to exhibit stuttering, freezing or the fps drops below 120.
How To Use Profiler?
To start using Profiler you'll need:
- Start your game by pressing Play
- Open Profiler by going to Window -> Analysis -> Profiler (or press Ctrl + 7)

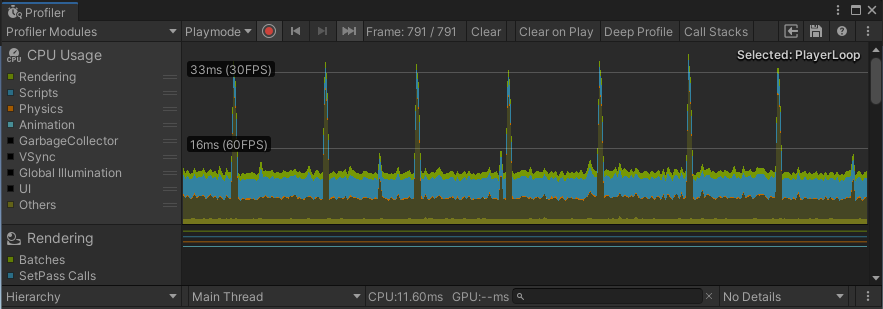
- New Window will appear that looks something like this:

- It might look intimidating at first (especially with all those charts etc.), but it's not the part we will be looking at.
- Click on the Timeline tab and change it to Hierarchy:
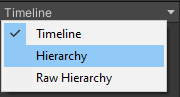
- You'll notice 3 sections (EditorLoop, PlayerLoop, and Profiler.CollectEditorStats):
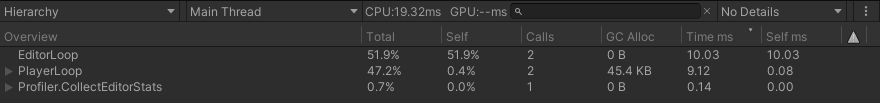
- Expand the PlayerLoop to see all the parts where the computation power is being spent (NOTE: If the PlayerLoop values are not updating, click on the "Clear" button at the top of the Profiler window).
For the best results, direct your game character to the situation (or place) where the game lags the most and wait for couple of seconds.
- After waiting a bit, Stop the game and observe the PlayerLoop list
You need to look at the GC Alloc value, which stands for Garbage Collection Allocation. This is a type of memory that has been allocated by the component but is no longer needed and is waiting to be freed by the Garbage Collection. Ideally, the code should not generate any garbage (or be as close to 0 as possible).
Time ms is also an important value, it shows how long the code took to run in milliseconds, so ideally, you should aim to reduce this value as well (by caching values, avoiding calling performance-demanding functions each Update, etc.).
To locate the troublesome parts faster, click on GC Alloc column to sort the values from higher to lower)
- In the CPU Usage chart click anywhere to skip to that frame. Specifically, we need to look at peaks, where the fps was the lowest:
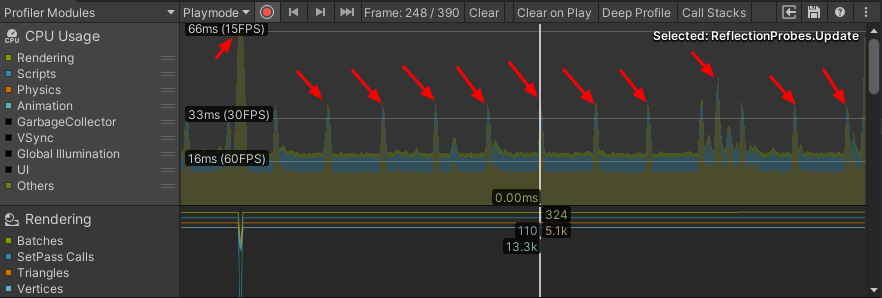
Here is what the Profiler revealed:
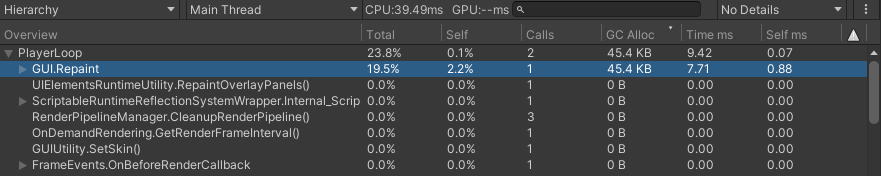
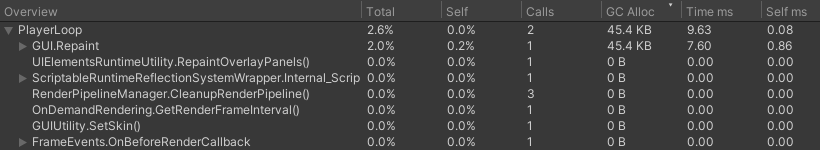
GUI.Repaint is allocating 45.4KB, which is quite a lot, expanding it revealed more info:

- It shows that most of the allocations are coming from GUIUtility.BeginGUI() and OnGUI() method in SC_ShowName script, knowing that we can begin optimizing.
GUIUtility.BeginGUI() represents an empty OnGUI() method (Yes, even the empty OnGUI() method allocates quite a lot of memory).
Use Google (or other search engine) to find the names you do not recognize.
Here is the OnGUI() part that needs to be optimized:
    void OnGUI()
    {
        //Show object name on screen
        Camera mainCamera = Camera.main;
        Vector2 screenPos = mainCamera.WorldToScreenPoint(transform.position + new Vector3(0, 1, 0));
        GUI.color = Color.green;
        GUI.Label(new Rect(screenPos.x - 150/2, Screen.height - screenPos.y, 150, 25), gameObject.name);
    }
Optimization
Let's begin optimizing.
Each SC_ShowName script calls its own OnGUI() method, which is not good considering we have 100 instances. So what can be done about it? The answer is: To have a single script with OnGUI() method that calls the GUI method for each Cube.
- First, I replaced the default OnGUI() in the SC_ShowName script with public void GUIMethod() which will be called from another script:
    public void GUIMethod()
    {
        //Show object name on screen
        Camera mainCamera = Camera.main;
        Vector2 screenPos = mainCamera.WorldToScreenPoint(transform.position + new Vector3(0, 1, 0));
        GUI.color = Color.green;
        GUI.Label(new Rect(screenPos.x - 150/2, Screen.height - screenPos.y, 150, 25), gameObject.name);
}- Then I created a new script and called it SC_GUIMethod:
SC_GUIMethod.cs
using UnityEngine;

public class SC_GUIMethod : MonoBehaviour
{
    SC_ShowName[] instances; //All instances where GUI method will be called

    void Start()
    {
        //Find all instances
        instances = FindObjectsOfType<SC_ShowName>();
    }

    void OnGUI()
    {
        for(int i = 0; i < instances.Length; i++)
        {
            instances[i].GUIMethod();
        }
    }
}
SC_GUIMethod will be attached to a random object in the scene and call all the GUI methods.
- We went from having 100 individual OnGUI() methods to having just one, let's press play and see the result:
![]()
- GUIUtility.BeginGUI() is now only allocating 368B instead of 36.7KB, a big reduction!
However, OnGUI() method is still allocating memory, but since we know it's only calling GUIMethod() from the SC_ShowName script, we are going straight to debugging that method.
But the Profiler only shows global information, how do we see what exactly is happening inside the method?
To debug inside the method, Unity has a handy API called Profiler.BeginSample
Profiler.BeginSample allows you to capture a specific section of the script, showing how long it took to complete and how much memory was allocated.
- Before using the Profiler class in code, we need to import the UnityEngine.Profiling namespace at the beginning of the script:
using UnityEngine.Profiling;- The Profiler Sample is captured by adding Profiler.BeginSample("SOME_NAME"); at the start of the capture and adding Profiler.EndSample(); at the end of the capture, like this:
        Profiler.BeginSample("SOME_CODE");
        //...your code goes here
        Profiler.EndSample();
Since I don't know what part of the GUIMethod() is causing memory allocations, I enclosed each line in the Profiler.BeginSample and Profiler.EndSample (But if your method has a lot of lines, you definitely don't need to enclose each line, just split it into even chunks and then work from there).
Here is a final method with Profiler Samples implemented:
    public void GUIMethod()
    {
        //Show object name on screen
        Profiler.BeginSample("sc_show_name part 1");
        Camera mainCamera = Camera.main;
        Profiler.EndSample();

        Profiler.BeginSample("sc_show_name part 2");
        Vector2 screenPos = mainCamera.WorldToScreenPoint(transform.position + new Vector3(0, 1, 0));
        Profiler.EndSample();

        Profiler.BeginSample("sc_show_name part 3");
        GUI.color = Color.green;
        GUI.Label(new Rect(screenPos.x - 150/2, Screen.height - screenPos.y, 150, 25), gameObject.name);
        Profiler.EndSample();
}- Now I press Play and see what it shows in the Profiler:
- For convenience, I searched for "sc_show_" in the Profiler, since all samples start with that name.
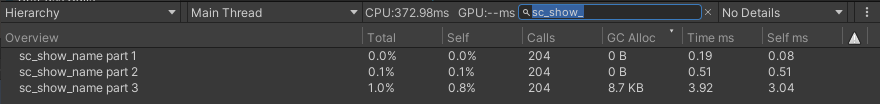
- Interesting... A lot of memory is being allocated in sc_show_names part 3, which corresponds to this part of the code:
        GUI.color = Color.green;
        GUI.Label(new Rect(screenPos.x - 150/2, Screen.height - screenPos.y, 150, 25), gameObject.name);
After some Googling, I discovered that getting Object's name allocates quite a lot of memory. The solution is to assign an Object's name to a string variable in void Start(), that way it will only be called once.
Here is the optimized code:
SC_ShowName.cs
using UnityEngine;
using UnityEngine.Profiling;

public class SC_ShowName : MonoBehaviour
{
    bool moveLeft = true;
    float movedDistance = 0;

    string objectName = "";

    // Start is called before the first frame update
    void Start()
    {
        moveLeft = Random.Range(0, 10) > 5;
        objectName = gameObject.name; //Store Object name to a variable
    }

    // Update is called once per frame
    void Update()
    {
        //Move left and right in ping-pong fashion
        if (moveLeft)
        {
            if(movedDistance > -2)
            {
                movedDistance -= Time.deltaTime;
                Vector3 currentPosition = transform.position;
                currentPosition.x -= Time.deltaTime;
                transform.position = currentPosition;
            }
            else
            {
                moveLeft = false;
            }
        }
        else
        {
            if (movedDistance < 2)
            {
                movedDistance += Time.deltaTime;
                Vector3 currentPosition = transform.position;
                currentPosition.x += Time.deltaTime;
                transform.position = currentPosition;
            }
            else
            {
                moveLeft = true;
            }
        }
    }

    public void GUIMethod()
    {
        //Show object name on screen
        Profiler.BeginSample("sc_show_name part 1");
        Camera mainCamera = Camera.main;
        Profiler.EndSample();

        Profiler.BeginSample("sc_show_name part 2");
        Vector2 screenPos = mainCamera.WorldToScreenPoint(transform.position + new Vector3(0, 1, 0));
        Profiler.EndSample();

        Profiler.BeginSample("sc_show_name part 3");
        GUI.color = Color.green;
        GUI.Label(new Rect(screenPos.x - 150/2, Screen.height - screenPos.y, 150, 25), objectName);
        Profiler.EndSample();
    }
}- Let's see what the Profiler is showing:
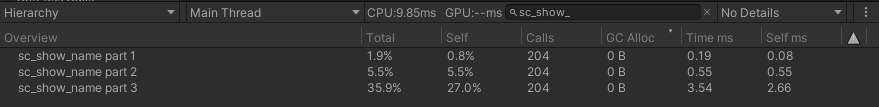
All samples are allocating 0B, so no more memory is being allocated.